Yesterday we tuned agent memory for cost and quality with context budgets, summaries, and scoring. None of that tuning is possible if you cannot see what the agent did. Day 25 is about observability: collecting the logs, traces, and metrics that explain an agent's behavior, cost, and failures.
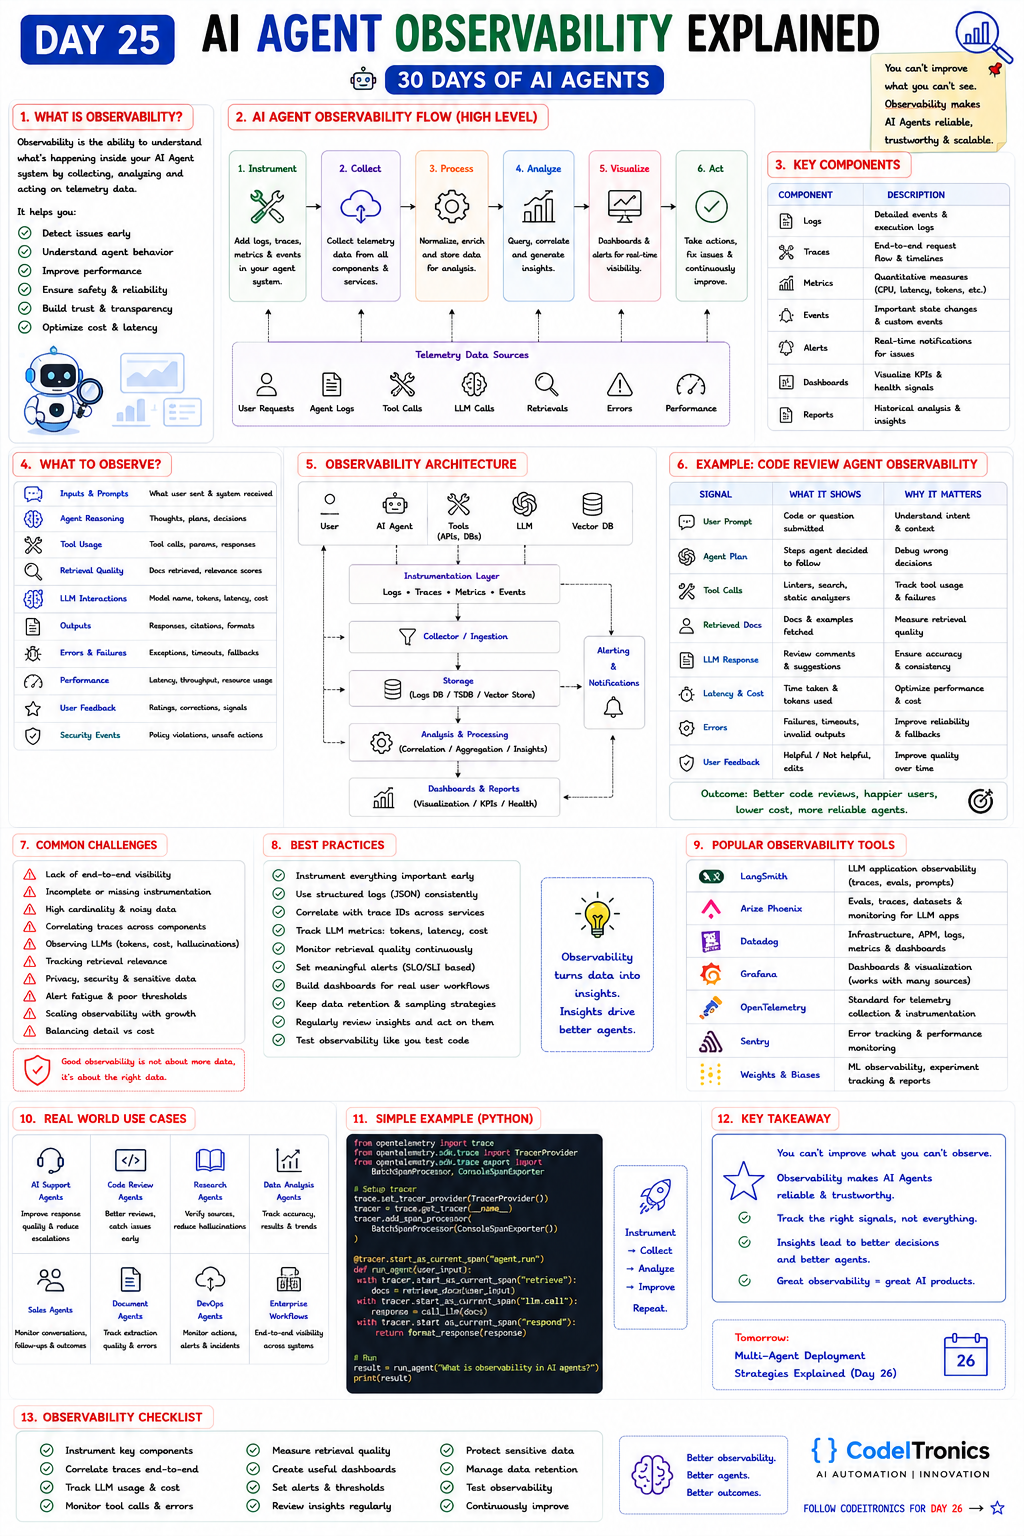
Save this sheet. The rest of this note walks through it section by section.
What observability means for agents
Observability is the ability to understand what is happening inside your agent system by collecting, analyzing, and acting on telemetry. It helps you detect issues early, understand agent behavior, improve performance, keep the system safe, build trust, and optimize cost and latency.
Traditional services fail loudly: an exception, a 500, a timeout. Agents often fail quietly. The request succeeds, the response is fluent, and the answer is wrong because retrieval returned a stale document or the planner skipped a step. Status codes will not show you that. You need to see the reasoning path: which prompt was sent, which tools were called with which arguments, what came back, and how much each step cost.
The observability flow
The sheet lays it out as six steps:
- Instrument. Add logs, traces, metrics, and events to the agent.
- Collect. Gather telemetry from every component and service.
- Process. Normalize, enrich, and store it.
- Analyze. Query and correlate to find patterns.
- Visualize. Dashboards and alerts for real-time visibility.
- Act. Fix issues and improve continuously.
The telemetry comes from user requests, agent logs, tool calls, LLM calls, retrievals, errors, and performance data. The step most teams get wrong is the first one: instrumentation added after the first incident always misses the data you needed during it.
Logs traces metrics and friends
| Component | What it gives you |
|---|---|
| Logs | Detailed events and execution records |
| Traces | The end-to-end path of one request, step by step, with timings |
| Metrics | Numbers over time: tokens, latency, error rates, CPU |
| Events | Important state changes and custom events |
| Alerts | Real-time notifications when something crosses a threshold |
| Dashboards | KPIs and health signals at a glance |
| Reports | Historical analysis and trends |
For agents, traces matter most. One user request becomes a tree of steps: plan, retrieve, call a tool, call the model, retry, respond. A trace keeps that tree intact so you can open a single bad answer and walk through exactly how it was produced.
What to observe
The sheet lists ten signal groups. Here they are with what to capture for each:
| Signal | What to capture |
|---|---|
| Inputs and prompts | What the user sent and the full prompt the system built |
| Agent reasoning | Plans and decisions, where your framework exposes them |
| Tool usage | Tool name, parameters, response, duration, errors |
| Retrieval quality | Document IDs retrieved and their relevance scores |
| LLM interactions | Model name, input and output tokens, latency, cost |
| Outputs | Responses, citations, format validity |
| Errors and failures | Exceptions, timeouts, fallbacks used |
| Performance | Latency, throughput, resource usage |
| User feedback | Ratings, corrections, escalations |
| Security events | Policy violations, blocked actions, guardrail triggers |
Two fields make everything else usable. A trace ID on every log line and span, so you can join a complaint to the exact run. And a prompt or agent version, so you can tell whether a change in behavior came from your deploy or from the input.
Tracing an agent with OpenTelemetry
OpenTelemetry is the vendor-neutral standard for telemetry, and most LLM observability tools can ingest it. Here is a minimal version of the sheet's example with nested spans and useful attributes.
from opentelemetry import trace
from opentelemetry.sdk.trace import TracerProvider
from opentelemetry.sdk.trace.export import BatchSpanProcessor, ConsoleSpanExporter

provider = TracerProvider()
provider.add_span_processor(BatchSpanProcessor(ConsoleSpanExporter()))
trace.set_tracer_provider(provider)
tracer = trace.get_tracer("support-agent")

def run_agent(question: str) -> str:
    with tracer.start_as_current_span("agent.run") as run:
        run.set_attribute("agent.version", "prompt-v7")
        with tracer.start_as_current_span("retrieve") as span:
            docs = retrieve(question)
            span.set_attribute("retrieval.doc_ids", [d.id for d in docs])
        with tracer.start_as_current_span("llm.call") as span:
            reply = call_llm(question, docs)
            span.set_attribute("llm.model", reply.model)
            span.set_attribute("llm.tokens.input", reply.input_tokens)
            span.set_attribute("llm.tokens.output", reply.output_tokens)
        return reply.text
In production, swap the console exporter for an OTLP exporter pointed at your backend. OpenTelemetry also has emerging semantic conventions for generative AI attributes; aligning attribute names with them makes switching tools easier later.
Worked example with a code review agent
The sheet's example instruments an agent that reviews pull requests:
| Signal | What it shows | Why it matters |
|---|---|---|
| User prompt | Code or question submitted | Understand intent and context |
| Agent plan | Steps the agent decided to follow | Debug wrong decisions |
| Tool calls | Linters, search, static analyzers | Track tool usage and failures |
| Retrieved docs | Docs and examples fetched | Measure retrieval quality |
| LLM response | Review comments and suggestions | Check accuracy and consistency |
| Latency and cost | Time taken and tokens used | Optimize performance and cost |
| Errors | Failures, timeouts, invalid outputs | Improve reliability and fallbacks |
| User feedback | Helpful or not, edits | Improve quality over time |
The valuable joins come from combining rows. Reviews marked unhelpful that also had zero retrieved docs point to a retrieval gap. Slow runs where the linter span dominates point to tooling, not the model. Without traces you would be guessing.
Architecture tools and pitfalls
The architecture: users, agents, tools, the LLM, and the vector DB feed an instrumentation layer; a collector ingests telemetry into storage (log store, time-series DB, trace store); an analysis layer correlates and aggregates; dashboards and reports sit on top, with alerting alongside.
Tools on the sheet: LangSmith (LLM tracing, evals, prompts), Arize Phoenix (evals and tracing for LLM apps), Datadog (infrastructure, APM, logs), Grafana (dashboards), OpenTelemetry (standard collection), Sentry (error tracking), and Weights and Biases (experiment tracking).
The challenges are familiar: no end-to-end visibility, missing instrumentation, high-cardinality noisy data, correlating traces across components, privacy of prompts that contain personal data, alert fatigue, and balancing detail against cost. The practices that address them: instrument early, use structured JSON logs, propagate trace IDs, track token usage and cost per request, alert on SLO-based thresholds rather than every error, set retention and sampling policies, redact sensitive fields before storage, and test observability like you test code.
Key Takeaways
- Agents fail quietly, so status codes are not enough; you need the reasoning path.
- Traces are the core signal: one request, one tree of plan, retrieval, tool, and model steps.
- Put a trace ID and an agent version on everything.
- Record tokens, latency, and cost per span so spend becomes a metric you can act on.
- Redact sensitive data and sample deliberately to control privacy risk and storage cost.
FAQs
Is observability the same as evaluation?
No. Observability records what happened in each run. Evaluation judges whether it was good. Good traces make evaluation much easier.
Should I log full prompts in production?
Log them where you can redact personal data and enforce retention limits. Without prompts, debugging agent behavior is mostly guesswork.
Do I need a specialized LLM observability tool?
Not to start. OpenTelemetry plus your existing stack works. Specialized tools add prompt views, eval integration, and cost dashboards that save time as you grow.
Up Next
Day 26 covers Multi-Agent Deployment Strategies: centralized, distributed, microservice, serverless, and hybrid setups, and how to keep many agents reliable once they run as real services. If you want observability built into your agent stack from the start, get in touch.

Letters to the editor
No letters yet. Questions and counterpoints are welcome.